The Report Explorer
The Report Explorer is all in one utility for reviewing, exploring, analyzing and getting overall insights of the result of the attack.
It's features includes -
- Easy GUI navigation.
- Sort HTTP requests based on columns.
- Filter the HTTP traffic by URL or String.
- Select & Copy rows, values, HTTP data.
- Search, Grep and count the occurrence of specific terms in HTTP traffic and web pages to quickly get the insights of the attack.
- Split report into smaller reports.
Now, let us show each feature one by one.
GUI of The Report Explorer
The GUI of The Report Explorer is inspired from GUI of BurpSuite to make it familiar for pentester.
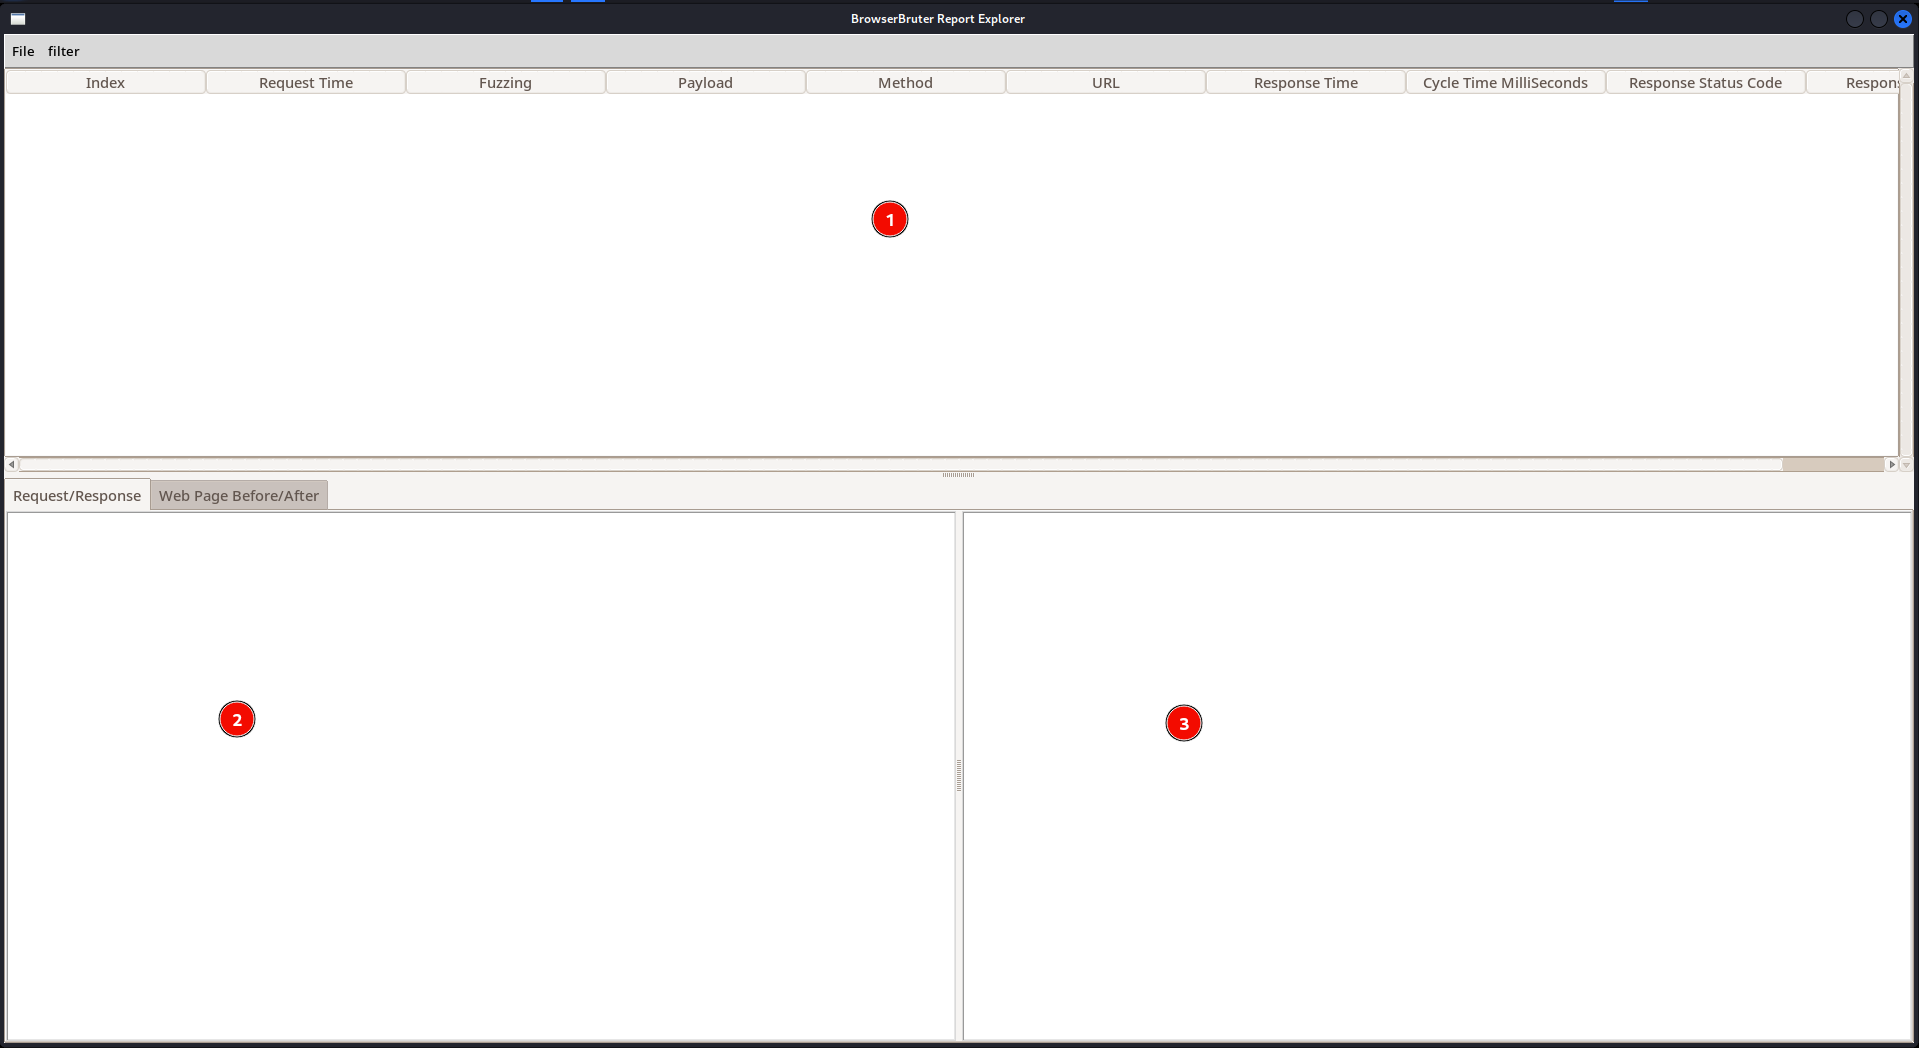
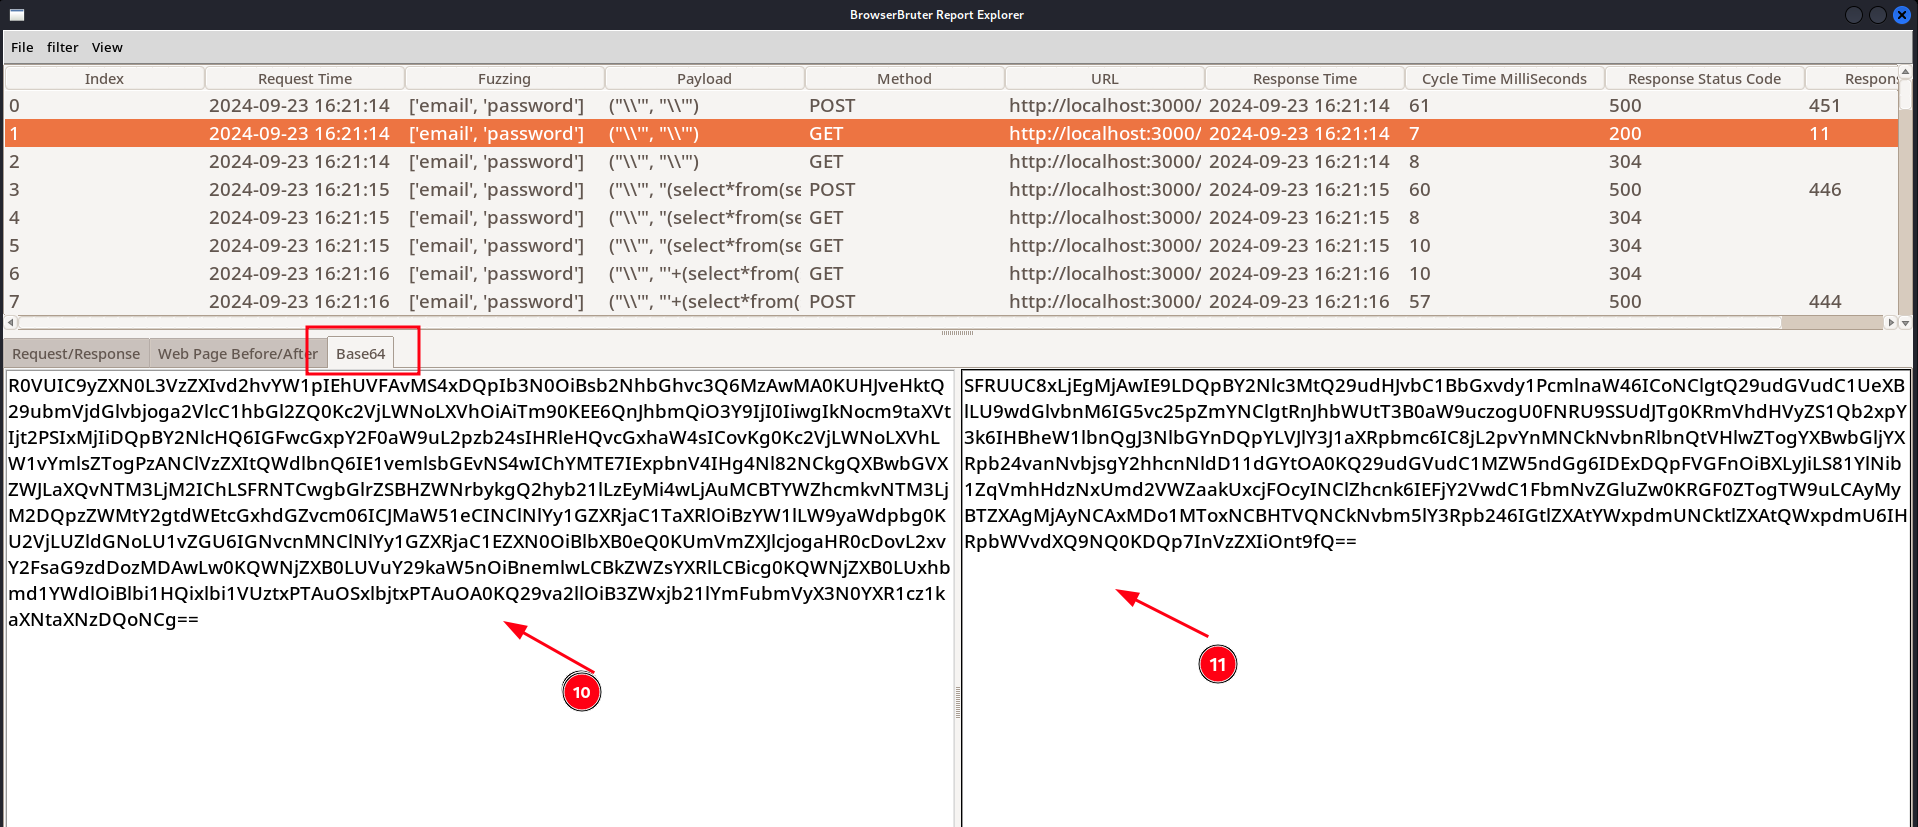
- 1 Is the table containing various columns indicating particular attribute.
- Here is the list of columns
 - Index
 - Request Time
 - Fuzzing (Specifies the element being fuzzed)
 - Payload
 - Method
 - URL
 - Response Time
 - Cycle Time MilliSeconds
 - Response Status Code
 - Response Length
- Here is the list of columns
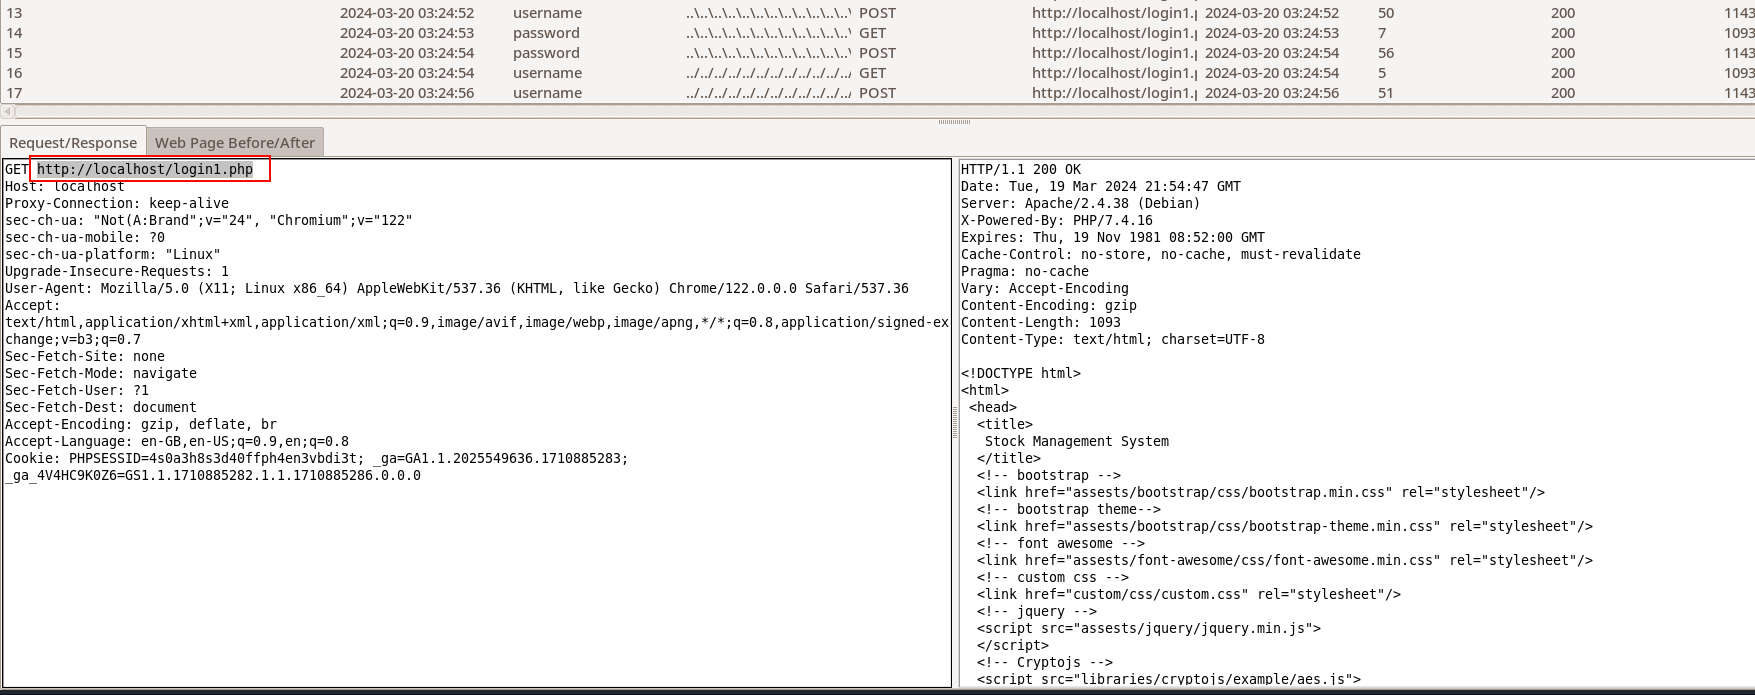
- 2 Is the HTTP request
- 3 Is the HTTP response
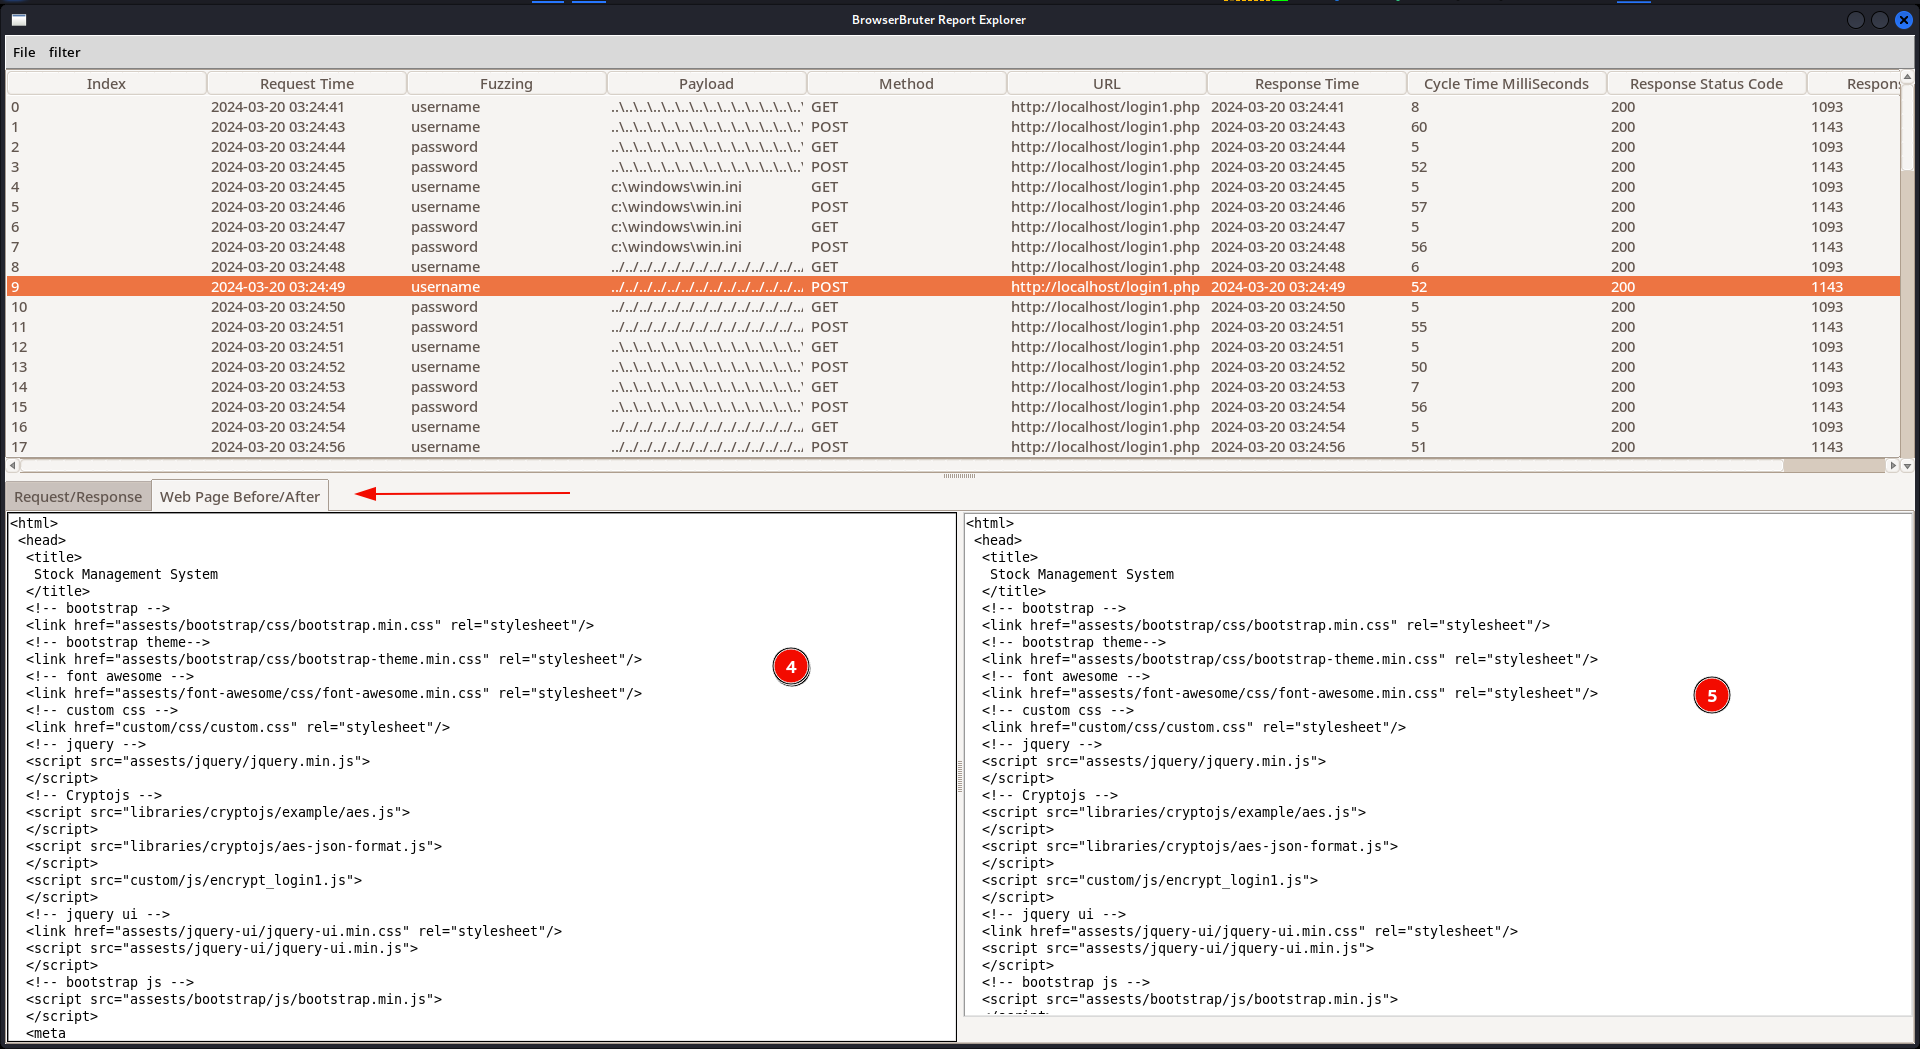
- 4 Is the Web Page source code before fuzzing the form
- 5 Is the web page source code after fuzzing the form.
Here, The web page source code is also stored in case the HTTP traffic is encrypted and gibberish so pentester can analyze the source of the web page to detect any vulnerabilities.
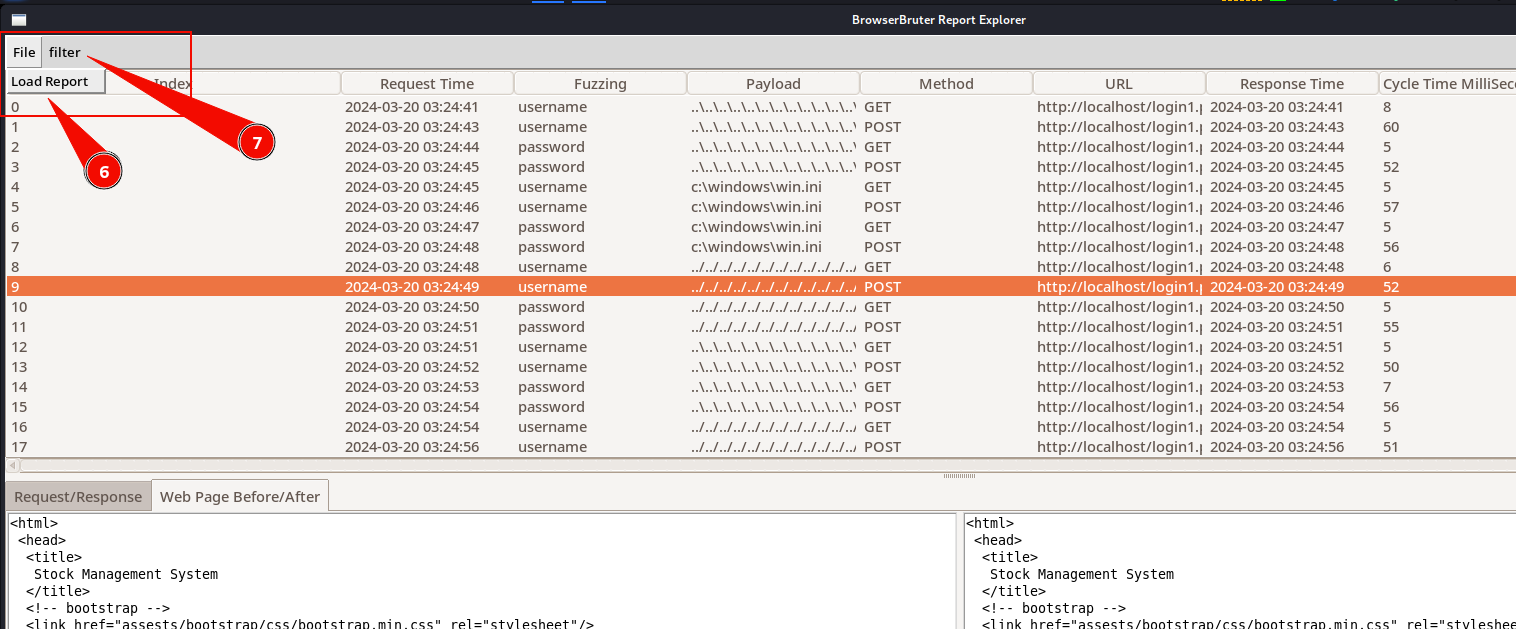
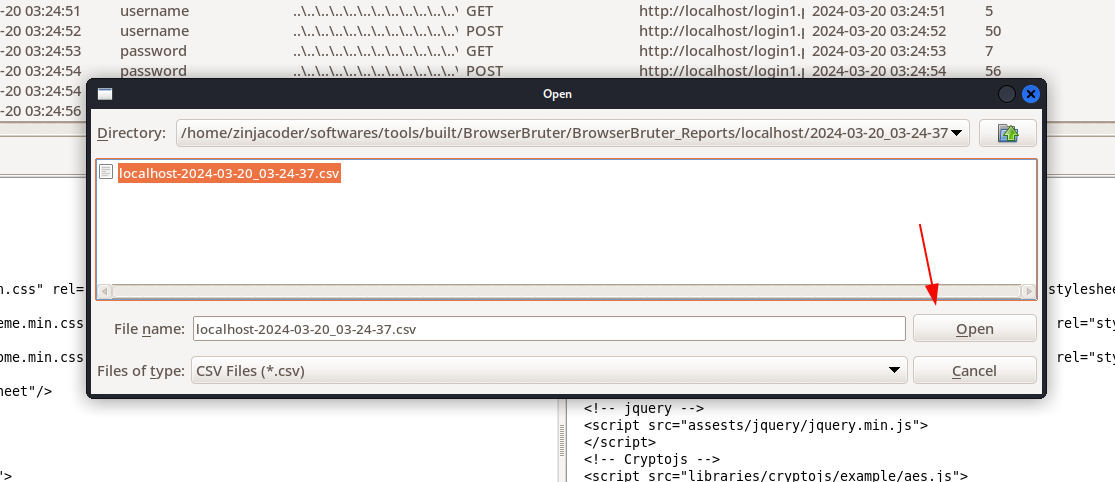
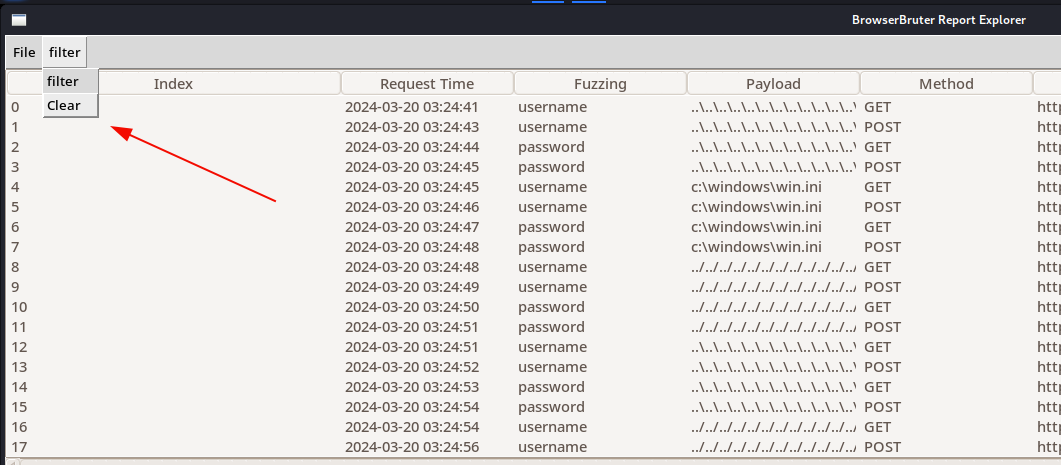
On top we have,
- 6 File button to load the report
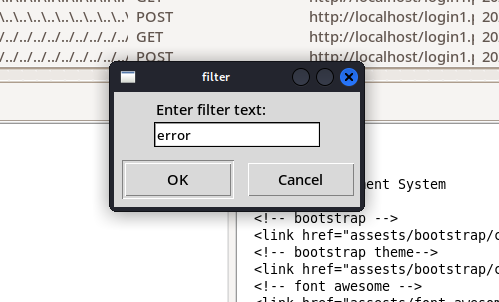
- 7 Filter button to filter out the HTTP traffic which does not have any specific string
- Clear button to clear the filter reload the report
We can copy the payloads or whole rows by right clicking on it -
8
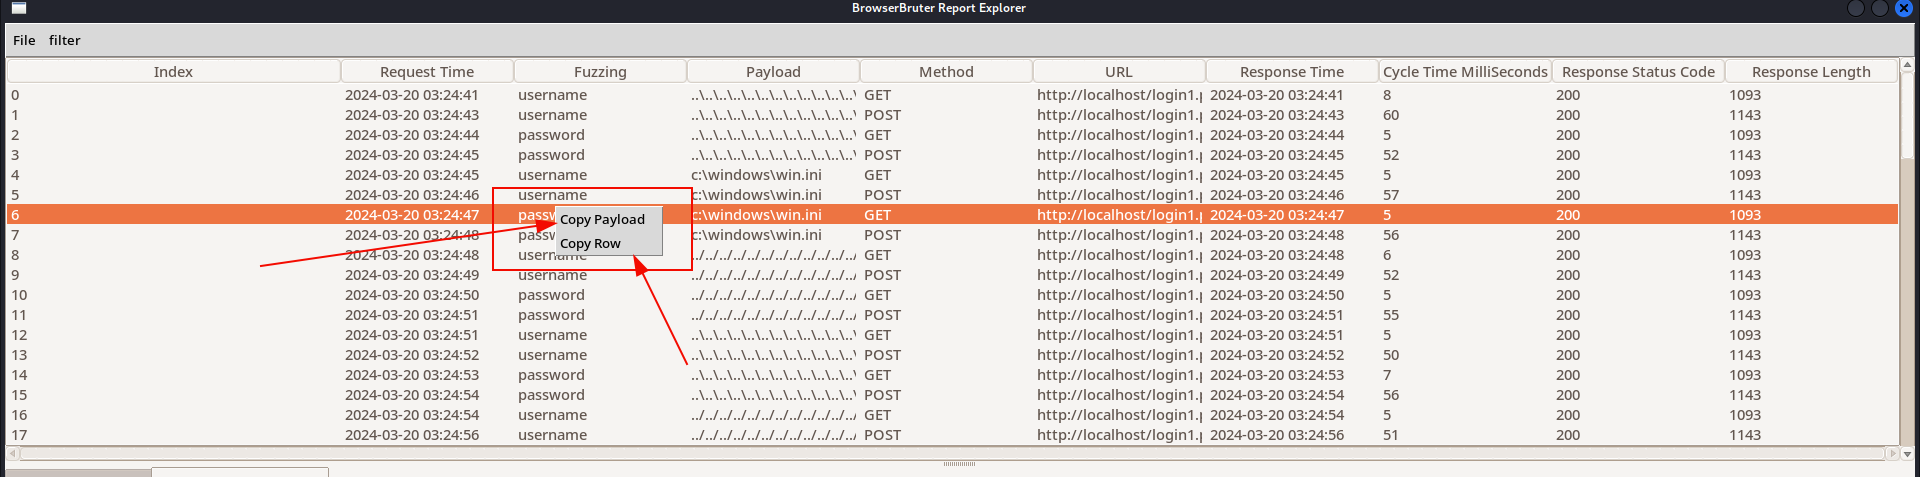
- Selecting
Copy Payloadoption will copy the payload of the row into clipboard. - Selecting
Copy Rowwill copy whole data of the row.
- Selecting
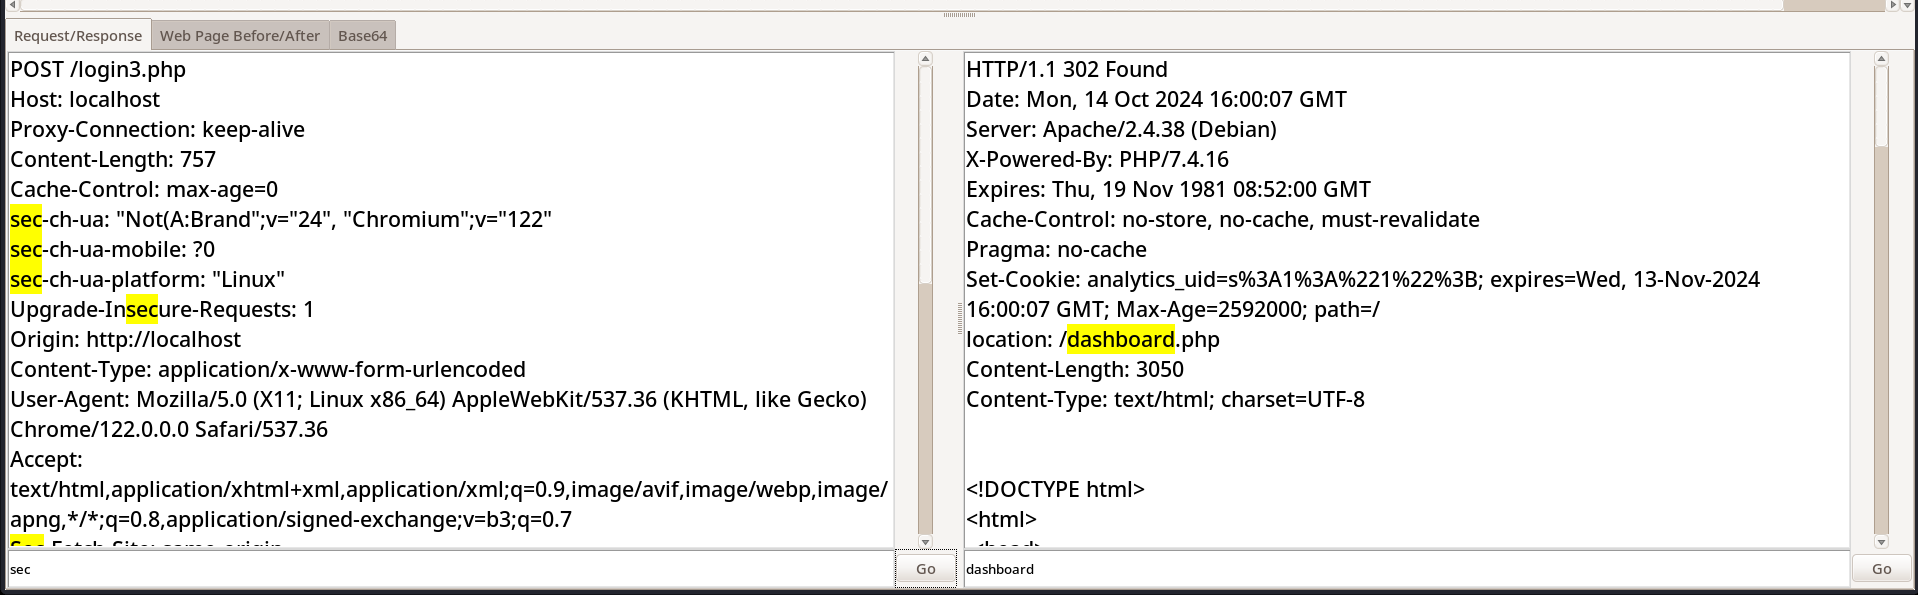
9 You can also select & copy values displayed in HTTP Request/Response and Web Page Before/After
10 Is the Raw HTTP request in Base64
- 11 Is the Raw HTTP response in Base64
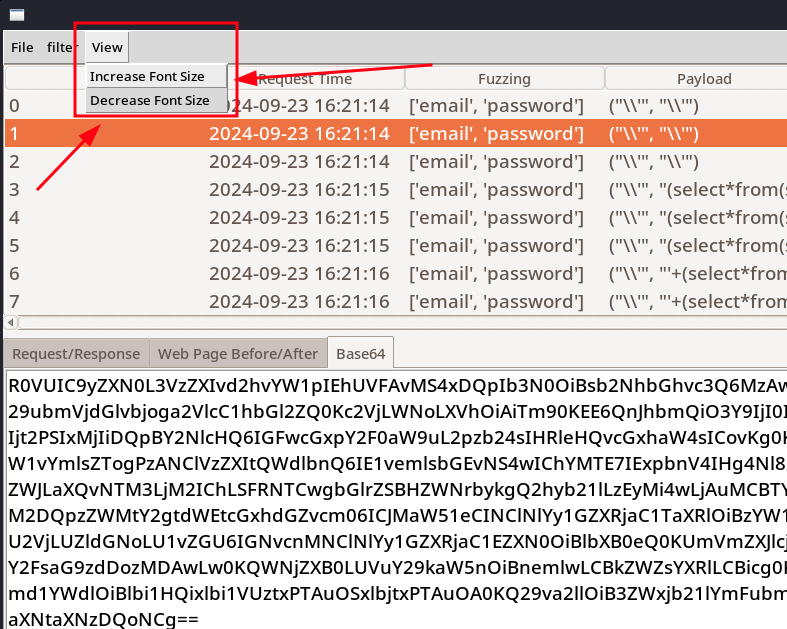
- 12 We can also increase and decrease the fonts of the ReportExplorer
13 You can also use the scroll bars in Request/Response, Base64 and web page before/after tabs.
14 You can even search the content for various keywords efficiently using Automatic Search functionality as show in video below.
Analyzing report by Sorting the data
You can sort the data of report based on columns by clicking on the columns
This is helpful when you want to analyze the result of the attack based on particular attribute like time taken by single HTTP request/response or length of HTTP response or Status of HTTP response.
The command line arguments - --rerport, --grep and --split-report
The --report option
The report can be loaded into the Report Explorer by specifying its path using --report option while starting the tool as show below -
The --split-report option
If you want to split the final report into smaller reports for reason like final report containing too many rows, you can do it using --split-report option.
Here we are splitting the final report into smaller chunks of reports containing 10 rows maximum.
Analyzing report like a wizard using --grep
One of the most advanced feature of the Report Explorer is the --grep option.
It allows you to specify various words or strings that you want to check whether they appear in HTTP traffic, Web page or not.
For example, here we are grepping error,exception,success,"login Successful","welcome admin" strings -
So, The Report Explorer creates new columns named by terms to searched in report.
And now when report is loaded, it will search the number of time they have occurred in that row will display it.
As we can see above, the error has appeared 8 times in all rows and other terms are not occurred at all so their count is 0. We can also sort the data according to these newly added columns.
We can combine the --report and --grep option to quickly load and grep the values as follows -
python3 ReportExplorer.py --report BrowserBruter_Reports/localhost/2024-03-20_03-24-37/localhost-2024-03-20_03-24-37.csv --grep error,exception,success,"login Successful","welcome admin"
Hope on to the next section to learn about how to contribute to this project.